The Buildout · Part 10Markets and rates
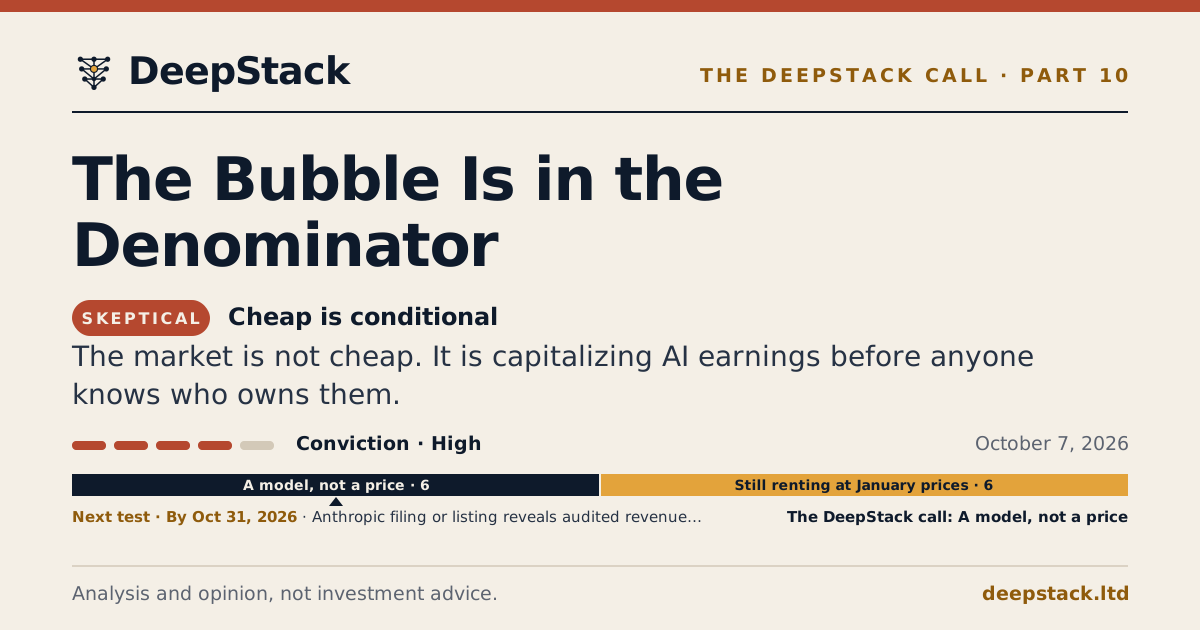
The Bubble Is in the Denominator
The S&P 500 looks cheaper because profits surged. But those profits depend on AI spending, chip values and debt that may be inflating the denominator while raising the discount rate.

Where this Part stands
- The question
- Does the hardware hold its value?
- The Call
SkepticalCheap is conditional.
The market is not cheap. It is capitalizing AI earnings before anyone knows who owns them.
Conviction High · 4 of 5
- The next test
What is established, and what remains uncertain
- What is established
- The S&P 500 trades at 19.0 times forward earnings, with third-quarter earnings growth expected at 29.5% (FactSet, October 2).
- The 10-year Treasury closed at 5.31% on October 5 (CNBC), above the forward earnings yield.
- Hyperscalers issued about $250 billion of high-grade bonds through August (Apollo presentation via Leyla Kunimoto).
- What remains uncertain
- Whether depreciation grows faster than operating income at the four hyperscalers (test p10-t01).
- Whether used-chip values and server lives hold after scarcity fades.
- Whether productivity rises enough for the rest of the economy to write the checks.
What is established and what remains uncertain: approved by Marco Cauduro on October 10, 2026.
Explain the mechanism Inspect the evidence Read the countercase See the test
On October 2, the S&P 500 offered investors a strange bargain: 19.0 times the earnings analysts expect over the next twelve months. That was below its five-year average of 19.8, its ten-year average of 19.1 and the 20.4 it fetched at the end of June, according to FactSet. The index then set a record on October 6.
The market was not getting cheaper because prices fell. Profits were outrunning them. Analysts expect third-quarter earnings to rise 29.5% from a year earlier, with information technology up 65%. The 10-year Treasury, meanwhile, closed at 5.31% on October 5, the highest in roughly two decades, according to CNBC. Inverting the S&P 500 multiple produces an earnings yieldExpected earnings divided by price: the inverse of the forward multiple, comparable in shape to a bond yield. More → of about 5.26%, almost the same number.
That is the market’s tell. The valuation is not obviously expensive on the numerator. The risk is that the denominator, swollen by the AI buildout and financed by debt, is less durable than it looks. If the spending creates productivity and lasting demand, today’s profits are an unusually solid foundation. If it mainly turns one company’s capital expenditureCash a company spends on long-lived assets: data centers, chips, networks, power. More → into another company’s revenue, the apparent bargain is a mirage with an interest bill.
A cheap top
Ren looked at the same arithmetic on October 5 and titled a portfolio update “The Cheapest ‘Bubble’ I’ve Ever Seen.” Semiconductors traded at 17.1 times forward earningsThe share price divided by the next twelve months' expected earnings per share. More → against 19.0 for the S&P 500, even though chips sit at the center of the largest capital-spending cycle. Michael Burry did the opposite: his trading post said he bought more far out-of-the-money MetLife puts expiring in 2029, acting on an expected AI boom-to-bust thesis.
The disagreement is not about price. A price-to-earnings ratio has two halves. Before the March 2000 peak, technology’s forward multiple rose about 250%; since October 2022, it rose about 14%, while chip stocks’ multiple shrank. Ren says profits carried the rally. Michael Howell of Capital Wars says he underestimated AI spending’s lift to earnings; David George at a16z credits technology with about 76% of S&P 500 profit growth through late August.
The stronger objection is that the profits may be the buildout paying itself. Scott Galloway ties AI fragility to the absence of regulation and says its reach extends beyond a handful of shares: the Magnificent Seven make up a third of the index, while the buildout drove a 32% increase in S&P earnings growth this year. Mia Silverio of Prof G Markets cited a Goldman Sachs estimate that half of this year’s earnings growth comes from AI investment, even as the other 493 companies grew profits 31.8% in the second quarter.
The market can therefore look cheap while its key earnings stream remains cyclical. A pause in spending would hit chips, memory, networking, power and construction together. The denominator would shrink, and 19 times a smaller number would cease to be 19 times in any useful sense.
There is a serious case on the other side. David George says rental rates and residual values were supposed to fall but have not; A100 rental prices are no lower than in January. JunkBondInvestor reports firm contracted rents and used-market prices even for GPUs three to six years old. Tae Kim relays Jensen Huang’s case that Nvidia’s GPUs are productive, fungible and durable. AWS has had more demand for AI capacity than it could supply, Kris of Potential Multibaggers says, despite large Nvidia orders and Amazon’s own chips.
Scarcity is doing real work in that story. Power, GPUs, transformers and skilled labor are all short, and chips and servers now absorb about 60% of hyperscalersOne of the largest cloud and platform companies that build data centers at continental scale. More →’ capital budgets. A scarce asset can retain rent while customers are waiting for capacity. That is the best case for the bulls, and it deserves to be taken literally: if demand keeps outrunning supply, eight-year economics may prove conservative.
Scarcity is also the weakness in the defense. The same shortage supporting rents supports the loans written against them. Ren warns that chip designs turn over faster than factories can be rebuilt; this year’s winning server could be beaten within five years. Kakashii estimates that Nvidia’s plan to ship more than 10 million Blackwell and Rubin chips by the end of 2026 implies roughly 20 gigawattsA unit of power: a megawatt serves a few hundred homes, a gigawatt a city; data centers are sized in both. More → of power, and holds that Blackwell GPUs ended up in warehouses because too few data centers had cooling and equipment. That makes a 19-times multiple no proof that the earnings are durable.
- S&P 50019.0x
- 5-year average19.8x
- 10-year average19.1x
- End of June20.4x
Source: FactSet, as of October 2, 2026
The depreciation test
Burry’s October 1 post attacked the accounting beneath Nvidia’s hardware optimism. An Nvidia slide put the B200 at 158% of its purchase price, the H100 at 58% and the A100 at 25%. Burry said these were not second-hand prices but outputs from a Silicon Data model that carries rental income eight years forward, begins utilization at 75% and then lets it decay. The A100’s entire 25%, he said, comes from adding years seven and eight to the model.
The purchase price matters too. Mercatus reported $56,000 per GPU for a B200 system, against the $45,000 assumption beneath Nvidia’s slide. At the higher price, Burry said the 158% figure falls to about 127%. The same slide places Nvidia’s accelerated depreciation scheduleThe accounting charge that spreads an asset's cost over the years it is assumed to last. More → beside an eight-year life: it loses 43% in year one and reaches zero about year five. Burry called the presentation “not even internally consistent” and expects GPU server prices to fall sharply, possibly as early as next year, when a memory shortage turns into a glut.
Who writes the checks
The revenue test is harsher. Torsten Slok of Apollo says adding technology analysts’ forecasts roughly doubles the sector’s operating cash flow to about $2.4 trillion by 2028, a gain of more than $1.2 trillion. Add the forecasts of technology’s customers and the rest of the S&P 500, and cash grows far more slowly. Slok’s question is the right one: “who exactly will be writing all those checks”. Hyperscaler credit, he says, rests on cash from operations tripling or better by 2030, while disclosure still offers no verifiable link between AI capital spending and the top line.
The bullish answer is that the buyer base is widening. Aurelion Research points to corporations, AI startups and other clouds, with more than $3.1 trillion of infrastructure commitments in prospect. Dell raised its estimate to 57 quadrillion tokensThe unit a language model is priced by: a fragment of text, roughly three quarters of a word. More → a month by the end of 2028 from 1 quadrillion; a Goldman Sachs figure ran about ten times higher. AWS is capacity-constrained, Kris says.
But usage is not the same as profitable demand. Daniel Romero puts OpenAI and Anthropic at a combined annual run rate near $105 billion in July, about $40 billion and $65 billion respectively, and says the line to watch is $400 billion by the end of 2027. Tae Kim says OpenAI’s annualized revenue is nearing $70 billion; Axios reported on September 29 that it had grown more than 70% since the start of the third quarter. Against that growth sits the loss-making base of the chain: Steve Eisman, in an episode with Ed Zitron, cited OpenAI’s $20.9 billion loss in 2025 on $13.07 billion of revenue.
Mia Silverio’s distinction is the cleanest. She sees a bubble in the labs rather than in the market as a whole and points to Nvidia’s shrinking valuation. Investors expected Anthropic to list in October at $2 trillion or more, according to PYMNTS. Citing Aswath Damodaran, Silverio says that price would require about $1.2 trillion of annual revenue inside a decade, while everything sold under the AI label adds up to roughly $250 billion today. Two customers supplied almost 25% of Anthropic’s 2025 revenue, and Amazon and Google channels carried 47% of its sales.
Michael Spencer adds a price warning: Ramp’s index showed what customers pay per million tokens down 41% from its March peak, to $0.68. Ren counters that OpenAI’s newest model charges more per token than its predecessor. The distinction matters. Cheaper intelligence can expand volume, but it can also compress the revenue needed to repay the hardware and bonds. Slok’s total factor productivity is still a little under zero and has not picked up since the spending cycle began. The BLS reported nonfarm business productivity up 1.4% annualized in the second quarter and 2.2% from a year earlier, while output per hour was growing near 2.5%.
The bubble is not in the multiple; it is in the time between spending and proof.
The bill raises the rate
Debt makes the loop harder to dismiss. Leyla Kunimoto, citing an Apollo presentation, reports that hyperscalers sold close to $250 billion of high-grade bonds in 2026, more than in the previous ten years combined. AI-linked borrowers made up 54% of net high-grade supply through August, against 34% in 2025 and next to nothing in 2024. The largest spenders may have cash and long-term contracts, as Ren argues. In aggregate, the bond market is underwriting a large share of the boom.
The 10-year yield now decides whether that financing is a tailwind or a trap. Mia Silverio says that with 5.3% available on a Treasury carrying no credit risk, stock buyers demand a higher return and pay less for each dollar of profit. Ren says a growth stock whose payoff lies far in the future must clear a 5% hurdle. Steve Eisman calls 5% the Rubicon, while noting that oil and the 10-year are the two variables that matter and neither is predictable.
Michael Howell reads the curve more kindly. Higher yields show an economy running hotter than policy is set for, he says, not fear about government solvency. The 10-year/5-year spreadThe extra yield a borrower pays above a Treasury of the same maturity, in basis points. More → has fallen by more than 40 basis pointsOne hundredth of a percentage point: 25 basis points is 0.25%. More → since late 2025, to about 14 basis points. With nominal yields above 5% and real yieldsThe yield on a Treasury whose principal rises with inflation: the price of money after inflation. More → near 3%, Howell calls this the best entry point in years and says past cycles began to buckle near 5.5%, so the next move may be down.
TSCS sees a different mechanism. Insurers that once absorbed long bonds now have arithmetic reasons to stay away; a Japanese insurer hedging back to yen earned about 95 basis points less on a Treasury than on a Japanese government bond on the only day with a published hedge cost. From the February 27 low, the 10-year rose 104 basis points, 96 of them real, while the decade-ahead inflation forecast barely moved despite Brent above $100. Vitaliy Katsenelson put the fiscal version bluntly: “I personally would not buy a 10-year Treasury even at 6%”.
Torsten Slok and Burry tie the rate rise directly to the buildout. Data centers, power plants, transmission lines, federal deficits and hyperscaler bonds all compete for savings that must last decades. If they are right, the borrowing that creates chip and construction revenue also raises the discount rate applied to that revenue. If Howell is right, 19 times earnings has room. The market is currently priced for Howell.
The tests ahead
Late October supplies the first hard check. Microsoft, Alphabet, Meta and Amazon will report third-quarter results. Depreciation against capital spending, any change to server lives and the arrival or failure of FactSet’s 29.5% earnings growth will show whether today’s denominator is being earned or merely deferred. An Anthropic filing would expose audited revenue, losses and customer concentration, turning Silverio’s two-customer figure and Romero’s $400 billion milestone into testable numbers.
The next used-GPU price will be more revealing than another forecast. George says A100s rent at January prices; Burry expects server prices to fall when memory scarcity becomes a glut. A three-year-old chip’s resale value shows whether the asset earns its keep after the shortage. A 5.5% 10-year yield will test Howell’s history against TSCS’s long-end warning. Total factor productivity will take longer, but it is the ultimate audit: if it rises, the rest of the economy can write the checks; if it stays flat, hyperscaler bondholders do.
What would prove DeepStack wrong is eight-year GPU economics, rising productivity and lab revenue reaching Slok’s checks.
The market is not paying too much for the denominator. It is paying before the denominator has finished becoming real. The bubble is not in the multiple; it is in the time between spending and proof.
Run the numbers
The figures in this story, built into charts you can test for yourself.
Data Desk · Part 10Markets
Run the denominator
The S&P 500 trades at 19.0 times forward earnings, which sounds reasonable until you set it beside a 10-year Treasury paying 5.12%. Cut the earnings, move the yield, and watch the gap to Treasuries change sign.
As of Oct 20, 2026 · irregular, with each Part on valuation · published Oct 20, 2026 · read Oct 21, 2026 · scenario · next release after the October 28 reports
Multiple at today’s prices19.0x
Stocks’ earnings yield5.26%
Forward earnings yield minus 10-year Treasury yield+14 bp
- 5-year average19.8xtoday 0.8x cheaper
- 10-year average19.1xtoday 0.1x cheaper
- End of June20.4xtoday 1.4x cheaper
This is a valuation sensitivity, not a risk-adjusted return comparison. Earnings are not contractual distributions, and the two assets differ in duration, growth, inflation exposure and risk.
At 19.0x, stocks yield 5.26% on forward profits against 5.12% on the 10-year. The forward earnings yield is 14 basis points above the 10-year Treasury yield.
Data Desk · Live · Part 10Markets
Profits ran ahead of the economy
US corporate profits against output per hour, both indexed to 100. Move the starting line and watch the gap Part 10 calls the denominator.
As of Oct 21, 2026, 6:30 a.m. ET · daily, at each build · published Oct 21, 2026, 6:30 a.m. ET · read Oct 21, 2026 · observed · next release the next weekday morning (6:30 a.m. ET)
Live data, updated Oct 21, 2026, 6:30 a.m. ET
Corporate profitsOutput per hour
Index, Q4 2022 = 100 (dashed line)
Since Q4 2022 (before ChatGPT), corporate profits are +38.9% and output per hour +9.1%. Profits have grown 4.3 times faster.
The DeepStack call
SkepticalCheap is conditional
The market is not cheap. It is capitalizing AI earnings before anyone knows who owns them.
What to do with this
- Hold the 5.26% earnings yield (19.0 times earnings) against the 10-year: when the bond pays more, stocks offer no risk premium.
- Stress-test the 29.5% earnings growth for server lives and depreciation before you pay for it.
- Treat the $250 billion of hyperscaler bonds as competition for the savings that set the discount rate.
What would change our mind
- Used-chip values and server lives hold after scarcity fades.
- Productivity turns higher and lab revenue compounds toward the checks the infrastructure requires.
Next test
All 6 testsRead the full argument
DeepStack’s view is that the market’s apparent cheapness is conditional, not protective. The most important reason is the circular financing loop: AI spending becomes supplier revenue and reported profit, while the bonds funding that spending compete for the savings that set the discount rate. That does not make every technology share a bubble, and the broad profit advance is real enough to keep the bullish case alive. The view changes if used-chip values hold after scarcity fades, server lives remain economic, productivity turns higher and lab revenue compounds toward the checks the infrastructure requires. Until then, the market is capitalizing an earnings stream before its economic owner has been identified.
Call history
- v2Cheap is conditionalConviction High (4/5)Side: A model, not a priceSide named by the owner.
- v1Cheap is conditionalConviction High (4/5)First call, as published with the story. The conviction, the actions and the flips were set down for the site on October 7, 2026.
The numbers behind the Call19.0x
Analysis and opinion, not investment advice.
What to watch
Microsoft and Alphabet report October 28, after Meta on October 21, and Amazon follows on October 29; depreciation, server lives and 29.5% growth will test the earnings denominator. Pre-specified
- Question
- Did the combined depreciation and amortization of Microsoft, Alphabet, Meta and Amazon for the quarter ended September 30, 2026 grow faster from the year-earlier quarter than their combined operating income?
- Source
- SEC EDGAR, the four companies' earnings releases (Form 8-K) and quarterly reports (Form 10-Q)
- Rule
- Sum depreciation and amortization, and sum operating income, for the four companies for the September quarter of 2026 and of 2025, from each release or 10-Q. The answer is yes if the year-over-year growth rate of depreciation is above the rate of operating income; no if it is equal or below. A change to server useful lives disclosed in the same filings is DeepStack's reading into the Result, not the answer.
- If the source is late, revised or silent
- If any of the four has not reported by November 7, 2026, or restates the year-earlier quarter, the test is inconclusive, and the Result says what was read and what was missing.
The Call, before the dateExpects yes. Gives the yes answer 75%.
0 · no100 · yes
The machinesClaude 80% · DeepSeek 85% · GPT 62%
1 reader has given a number so far; the readers’ median prints from 25.
Your numberSign in by email to forecast
Anthropic filing or listing reveals audited revenue, losses and concentration, testing the $400B revenue milestone. Pre-specified
- Question
- Did Anthropic file a registration statement (Form S-1 or equivalent) with audited financial statements on SEC EDGAR, or begin trading, by October 31, 2026?
- Source
- SEC EDGAR, Anthropic filings
- Rule
- The answer is yes if a registration statement for Anthropic carrying audited revenue, net loss and customer-concentration disclosures is public on EDGAR by October 31, 2026, or its shares begin trading by that date; no otherwise. The audited figures against the $400 billion run-rate line Romero named for the end of 2027, and the two-customer share Silverio cited, are DeepStack's reading into the Result.
- If the source is late, revised or silent
- A confidential draft filing reported in the press but not public on EDGAR, or a filing without audited statements, is inconclusive, and the Result says what was read and what was missing.
Your numberSign in by email to forecast
- At 5.5% 10-year
A 5.5% Treasury yield tests Howell’s turning-point history against TSCS’s warning that the long end will keep rising. Open question
Specification pending
Your numberSign in by email to forecast
- Next used-GPU print
Three-year-old chip rents and resale prices show whether scarcity or durable economics supports hardware values. Open question
Specification pending
Your numberSign in by email to forecast
- Productivity data
A rise in total factor productivity would show the rest of the economy can write the checks; a flat reading leaves bondholders exposed. Open question
Specification pending
Your numberSign in by email to forecast
The record holds or breaks: whether the Thrift Savings Plan's C Fund, which holds the S&P 500 with dividends reinvested, closes above its October 6 high of $126.18 on any day through July 12, 2027. Pre-specified
- Question
- Does the C Fund of the Thrift Savings Plan, the federal employees' S&P 500 index fund, close above $126.1817, its highest share price through October 12, 2026 (set on October 6, 2026), on any business day from October 13, 2026 through July 12, 2027?
- Source
- Thrift Savings Plan, share price history of the C Fund (daily closing share prices, tsp.gov)
- Rule
- Read the C Fund's daily share prices from October 13, 2026 through July 12, 2027 in the plan's share price history. The answer is yes if any of them is above $126.1817, the highest close through October 12, 2026 (October 6; the plan posted no price on October 12, a federal holiday); no if every one is at or below it. The fund holds the stocks of the S&P 500 and reinvests their dividends, so its share price is the record the test reads.
- If the source is late, revised or silent
- If the plan has not posted the prices through July 12, 2027 by July 19, 2027, the test is inconclusive, and the Result says what was read, what was missing and the day of the next reading. A price the plan corrects is read as corrected.
The Call, before the dateEither answer fits the Call. Gives the yes answer 88%.
0 · no100 · yes
The machinesClaude 83% · DeepSeek 67% · GPT 58%
Your numberSign in by email to forecast
The machines: Each model read this page and nothing else. The number that counts is the latest one each model gave before the test closed.
Follow
Follow Part 10: one email when one of its tests resolves.
Sources and further reading (9)
- FactSet - S&P 500 earnings multiples and estimates
- CNBC - 10-year Treasury yield
- a16z - technology profit growth
- Prof G Markets - AI and earnings
- Aurelion Research - Nvidia and infrastructure
- Apollo - hyperscaler credit and cash flow
- Axios - OpenAI annual revenue
- PYMNTS - Anthropic listing expectations
- BLS - productivity release
Market data are as of the dates cited. An earlier version of this research appeared on DeepStack’s Substack.